As a recent tech boot camp grad, maintaining the delicate balance of retaining what I have learned and living life has been a struggle. Here are some tips to stay focused and keep yourself engaged in the journey.
Hey, its the end of August 2021. I am still here. 👍 I published an article in the AHIMA Journal at the beginning of the month. Last post was about why I attended a tech boot camp (cause 🐍 is awesome!). This post is going to be about some suggestions to stay focused and engaged after the journey.
I am passionate and proud about my work history in Healthcare. Additionally, I have this undying drive that my Data Analytics journey has given me transferrable skills applicable to my industry and prior work experience. For those of you who are evaluating adopting this journey yourselves, consider those transferrable skills you use daily. Look at new and emerging job descriptions in healthcare. What data do you want to analyze? Medical claims data? Quality measure data related to HEDIS? Is there a clinical specialty you have current or past experience with? Think about the problems you have seen in your past and current work experience. How can having more information(AKA: data) related to those problems influence positive changes in the business as a whole?
Research job descriptions to see new and emerging roles. My current role deals specifically with internal healthcare claims data. Some data analyst job descriptions, even when adding the key terms “Health” or “Healthcare” to “data analyst”, can branch into something like a data engineering/data science/data analytics role with software development experience and 3-5 years of ETL/Data Manipulation/Data Cleaning/production/project management experience. All that to say, don’t get caught up in the overwhelming aspect of the job description. If the role interests you and you feel you can utilize your experience towards, evaluate what problem the business or entity strives to solve. Then, ask yourself whether you can use your experience to solve that problem. This might require you to learn some additional skills like Python/SQL or even other tech skills. Know that ultimately, learning those skills will challenge you to grow in ways you never thought were possible.
After you have done some soul searching, start goal setting. If you see certain job descriptions that interest you, ask yourself why. Then develop a plan of action. I am a fan of creating a portfolio of projects to demonstrate those skills. After your portfolio is created, publish it to your social media like LinkedIn or you can even look into starting a blog about your journey. Write about it and test yourself by demonstrating those skills.
I am beyond grateful for the experience during my Bootcamp Journey. Not only was it a huge challenge, it gave me a love of problem solving and troubleshooting I didn’t realize I had. You cant expect it to end when you have finished studying. You must put in the work to reap the rewards! I find the process of writing code and troubleshooting bugs super fun, despite my frustration. Nothing beats that “AHA!!” moment when something works after a few days. If you decide to take on this journey as part of your career, take the time to get familiar with Kaggle. Set up a Github login and utilize YouTube to get started. I know many of you are experiencing challenges in your career right now. Use some of those HIM skills into a more tech focused career. Take the time to learn some Python and SQL, and start developing a portfolio of projects that solve the problems we are facing in our industry.
Back at the end of August I enrolled into a bootcamp through Practicum By Yandex focused on Data Analysis. At the time, my thought was to develop skills to make me a better analyst. I knew that the experience would leave a lasting impression and give me skills that my HIM background and education didn’t provide me. I have always been intrigued with anything tech related. I realized that the RHIA program gave me an overall generalization of many different technologies used in HIM today, more advanced applications would have been helpful to apply in healthcare.
It took me a solid 7 months to complete this program. We had access to a tutor through a chat program called Slack and also access to other students. Although the curriculum was focused on data, the curriculum did not place a large emphasis on math/ statistics or machine learning concepts that their Data Science path taught. Despite this, I felt that the program did provide me an imperative overview of statistics commonly used in Data Analytics. My goal in pursuing this bootcamp was to gain additional skills while working towards the CHDA certification through AHIMA this year. The language that was used in the curriculum was a programming language called Python, where we used Jupyter Notebook to provide insight and query the and tell its story. The insight was derived by “Exploring” the data or performing EDA (Exploratory Data Analysis) through typing commands in the notebook. We also did some Querying through a program called SQL or Structured Query Language and also created some Tableau dashboards
Here is a dataset that was a subset of the inpatient charge data from FY 2017. If you want to do some analysis on your own of this dataset feel free to check out here
In this data we looked at patients that were reported as having Congestive Heart Failure. First I looked at the mean length of stay for the male vs female population of the dataset to gain some additional insight on population differences between genders.
#mean LOS by gender
CHFgenders = df.groupby('Gender Description', as_index=False).agg({'LOS' : 'mean'})
display(CHFgenders)

barplot = CHFgenders.plot(x='Gender Description', kind='bar')
plt.title('Average LOS by Gender')
plt.ylabel('LOS', fontsize=12)
plt.xlabel('Gender', fontsize=12)


plt.show()
We see that the mean length of stay between males and females is pretty similar with female populating being slightly higher
Then I evaluated the mean DRG per gender to evaluate any trends in the top DRG’s that were reported in the data set.
#mean count of patients with the drg by gender
DRG_by_gender = df.groupby(['drgcode', 'Gender Description']).mean()['Patient'].reset_index()
display(DRG_by_gender)

plt.figure(figsize=(10, 7))
sns.barplot(data=DRG_by_gender, x='drgcode', y='Patient', hue='Gender Description')
plt.title('Average DRG by Gender', size=16)
plt.ylabel('Patient', fontsize=14)
plt.xlabel('DRG', fontsize=14)
plt.xticks(rotation=90)
plt.show()
This data demonstrates that the top DRG for females is DRG 292-: HEART FAILURE AND SHOCK WITH COMPLICATION OR COMORBIDITY (CC). The top DRG for Males for this data set is 291-: HEART FAILURE AND SHOCK WITH MAJOR COMPLICATION OR COMORBIDITY (MCC). I found this a bit interesting that the female population demonstrated that the severity was less for females compared to males.
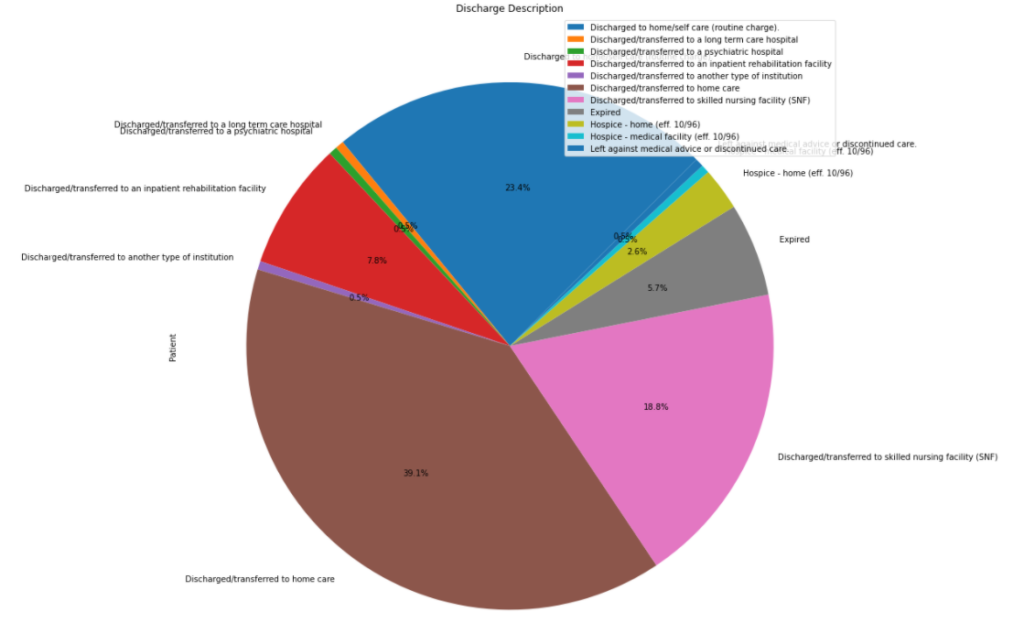
I then did some additional evaluation comparing the average discharge by gender to see the trends were with males compared to female population in this data set
I then split out the male and female populations from this dataset and provided separate pie charts that demonstrate this information in a more granular level by gender.
top discharge for male is discharged to SNF and self care
Lets do some hypothesis testing to evaluate this information. When we review the Mean length of stay we see that the length of stay for females is shorter than males. However, when we do a hypothesis test, we see that the alternative hypothesis states that the count of patients with certain DRG’s is different from males to females. The data above supports this. Lets look at some hypothesis testing to further evaluate this information.
t -test comparing males to females
However when we do a more detailed hypothesis test comparing females to males for each DRG we see different results.
#Check whether the difference between the groups is statistically significant for DRG 291.
import scipy.stats as stats

print("{0:.3f}".format(stats.mannwhitneyu(DRG291[DRG291['Gender Description']=="Female"]['Patient'], DRG291[DRG291['Gender Description']=="Male"]['Patient'])[1]))
print("{0:.3f}".format(DRG291[DRG291['Gender Description']=="Female"]['Patient'].mean()/DRG291[DRG291['Gender Description']=="Male"]['Patient'].mean()-1))

alpha = .05 #significance level

results2 = st.mannwhitneyu(DRG291[DRG291['Gender Description']=="Female"]['Patient'], DRG291[DRG291['Gender Description']=="Male"]['Patient'])

print('p-value: ', results2.pvalue)

if (results2.pvalue < alpha):
    print("H1 (the alternative hypothesis): there is a statistically significant difference in DRG 291 in average population of females and males")
else:
    print("H0 (the null hypothesis): there's not a statistically significant difference in DRG 291 in average population of females and males")
Results of hypothesis test for DRG 291
Followed the same process with DRG 292 and 292 and came up with the same result, that there is not a statistically significant difference for the average population of females to males. So, although my initial review demonstrated a statistically significant difference in the population of females to males, when we looked at the individual DRG’s for the population of females to males, there was not a statistically significant difference. You can find the github repo of this project please click here.
I would not have been able to attenuate these correlations without my bootcamp experience. Although it was extremely challenging, the experience really made me see how tech skills really are needed more in the HIM profession. The curriculum in Bootcamp, was very different compared to my HIM degree but it challenged me to think of how we can solve the problems we encounter in healthcare by sifting through data. I hope you enjoyed this example of how I used Python and its libraries to perform exploratory data analysis with public data sets available. I challenge future HIM professionals to evaluate how gaining additional tech skills can provide an opportunity for you to excel as an HIM professional.
I had the pleasure of speaking about Leadership with Jim Zelem, creator of the “You Are Just a Number” podcast. (Link can be found to his podcast page here). We discussed quite a few things namely, my creation of this blog and the importance of making an impact in healthcare, even if you don’t have a “leadership” or “managerial” title.
Aside from being interviewed, this experience further solidified my goal through this blogsite. I want this to provide an opportunity for others to see and challenge how they can apply their experience in healthcare through different avenues. Think about what the future of healthcare is going to do to your role? How will you remain a competitive employee in a world where process automation is becoming the norm? I challenged myself by enrolling in a boot camp that teaches data analytics using Python. I did this because I see how traditional HIM roles are changing. Even now, AHIMA is implementing a change to the RHIA certification come March 2021 because, we as HIM professionals more than ever, are needed to be masters of health data.
I hope you find this interview insightful and encouraging!
If you notice the image above you may think, why is a blog post about tech not more “trendy”… where the images of computer chips and fancy graphics? We will get to that later. First we are going to do a brief synopsis of HL7.
A dear friend of mine asked me to speak to her students as an introduction to HL7 or Health Layer 7. In our HIM curricula, we are taught that HL7 was the introduction of technology implementation in the healthcare space. It birthed the beginnings of Meaningful Use and is our modern day enforcement of quality measures in MIPS and MACRA. In the US healthcare system, CMS guidelines from meaningful use enforce quality care over quantity care in the US healthcare system. While this is important, HL7 is actually so much bigger than that.
If you look at the titles to the books in the image above, you might notice that there are some computer programming languages in the titles like C#, Visual Basic and Java. This is helpful to know because what you need to know about HL7 is that it is a set of standards that are required for any software application that is utilized to collect healthcare data. This was mandated by CMS (Centers for Medicare and Medicaid Services) as part of the HIPAA mandate of 1996. HL7 is important for health information management professionals because it provides the guidance for anything and everything related to healthcare data. Think about the technology you utilize today. Are you able to access healthcare data on your phone? How are you accessing it? Are you prompted to log into a website or app? HL7 is a standard that defines what can be accessed, stored and uploaded onto a site or through a software application. These standards define how clinical information can be moved and transferred through various systems or applications and provide guidelines on what the data is and how it is going to be shared. Without standards data is just a jumble of numbers and letters.
As new Health Information Management professionals enter the job market, it is important to keep this information in mind while you are pursuing your career journey. This is part of why Medical Coding for Millennials was created. As a health information management professional, I accept the fact that I have my cert in Medical Coding… but I also see the value in knowing these technologies and using them to access and provide a picture of the patient story in the data we collecting in the profession.
For more information about HL7 and its application in healthcare check out these articles.
Do a google search on the term “Healthcare Programmer” and “Health Data Scientist” you will get some interesting responses. Some related to IT or IS systems, Some requiring Medical Coding knowledge. Usually or very rarely any information of how these two can intersect. If you are like myself continuing my journey into healthcare data has proven to be challenging.
The process of health data mining is known as Medical Coding or Abstracting. This is usually performed by individuals being assigned a specialty like Inpatient or Cardiology and assigning ICD 10 CM/PCS and/or CPT/HCPCS Classifications to interpret the patient medical record into a series of numbers computers can understand. Abstracting the medical record is necessary in healthcare today because of the Centers for Medicare and Medicaid services require it of hospitals and physician practices to demonstrate compliance. As of current, it is largely manual in nature. . Although EHR vendors tout to have made the process electronic, it usually requires APIs to work efficiently. If you are transitioning into this industry, be prepared for this. Especially if you plan on being employed in any Machine Learning or Automation process. All aspects of this field require some sort of clinical knowledge.
Most health data analytics roles want staff who know SQL or Access or another RDMS system. They also want to know you can Visualize the data into meaningful information using Tableau. This is especially valuable today because so many hospitals need this information to recover lost finances and claim Denials are an easy trend to measure. Some of these trends do require some clinical experience like a Nurse Informatics role or a Nurse Auditing role. You might be able to negotiate if you have a clinical documentation certification (CCDS or CDIP).
As health information technology continue to challenge the scope of practice, continue to evaluate and ask where the next 10 years will take you. Any technological advancement requires consistent change and commitment to growth. Take that as a challenge and come along for the ride and show those recruiters what you can do!
Hey all those computer classes through our RHIA program mean something! I have been raised around technology all my life… I typed commands in DOS to play games when I was 6. I took computer programming classes and computer application classes all 4 years of high school, (I was the only woman one in those classes BTW). Despite my passion and love for technology, I still struggle with being insecure about my math skills. The beauty of computers though, they do all that for you! This has removed so many barriers to others who have experienced similar challenges. Back then, the internet and web browsers worked completely different. It was a massive blank canvas.
So, what does being STEM designated mean for the future of HIM? Even though the RHIA credential being considered an official STEM career, according to the Bureau of Labor Statistics, We still have so much more work to do. I look back on my certification exam and wonder why more questions were not asked that were more technical. Why didn’t they challenge me as a student to actually create an app using mobile programming language like Swift or Java? Why wasn’t one of my assignments uploading data from a .CSV file into Tableau or Python or R? Why weren’t there data visualization challenge creating trends on patient populations in a certain demographic area? If healthcare is a very “data rich” industry, why aren’t we learning how to use that data for bettering the health of our patient populations? Why aren’t we, the newly credentialed students, informing our healthcare organizations of what needs to change so we can help our communities and gain revenue?
I think that as this starts to be announced widely, it will challenge CAHIIM and AHIMA, as well as the many educational institutions they credential, to step it up. This will ensure students and newly credentialed members will be better prepared to tackle the technological challenges we will continue to face over the next 10+ years.
Screenshot of an image from the game Stardew Valley. A fun and simple farming RPG
Do you worry about being held hostage by your cubicle? You obtained your credentials as a Medical Coder, now what do you do? Remember you aren’t limited to just one role. There are so many other possibilities and positions available for credentialed professionals where you can utilize your skills and credentials. Lets go through a couple examples.
I did my first virtual webinar this week with my local AAPC chapter on a non-traditional medical coding topic. Although I have my medical coding certification, I have been working in Medical billing and appeals over the past 5 years. I really enjoy the troubleshooting aspect of it. Stuff gets submitted to the payer broken, error message ensues, then you try and “fix” it. This has been my new norm for the past 4+ years. I did it on the physician side for 2 years, now I am doing it on the hospital side…and even with the current state of healthcare, there are no signs of this process stopping any time soon. Although medical coding is prior to the health insurance claim being submitted to the insurance company, the point I made in my presentation was that it is helpful to have medical coders in different aspects of the healthcare business cycle. Think about it, Medical Coding professionals have to understand how and why codes are assigned to the claim for billing. With this information, your medical coding professionals, especially newer students, and might be able to help getting those “error messages” overturned. This can result in reimbursement for services for the facility or healthcare providers practice.
Why Denials continue to be a problem?
You can think of an insurance denial as an “error message” preventing payment to your providers office or healthcare facility. Knowing and understanding how to resolve a denial requires a deep understanding of medical coding and the codes that insurance companies use to communicate denied claims. These are often known as Reason and Remark codes and can be found here.
Your Medicare Administrative Contractors can be huge resources in this process. They often have free webinars that can provide you invaluable information on medicare guidelines for reimbursement, along with common denials that occur within their jurisdiction that might help in understanding claim resolution processes. The more you see and understand different types of denials you encounter, the more comfortable you will become with the process needed to obtain appropriate reimbursement for the services provided by your facility or physician.